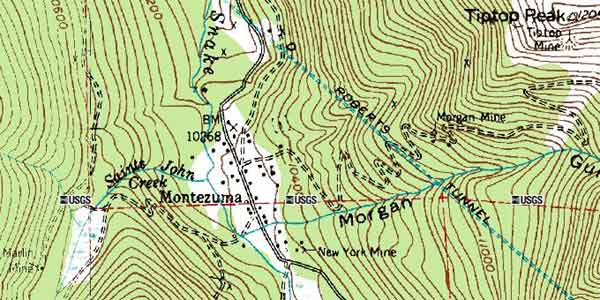
Isarithmic Map- uses lines or colors to define regions of the same value.
 |
| Topographic map of elevation intervals. |
Choropleth Map- uses different colors to define areas with different features, characteristics, or values. If monochromatic, varying lightness in color often indicates qualitative data.
 |
Differing terms for the same product, nationwide.
|
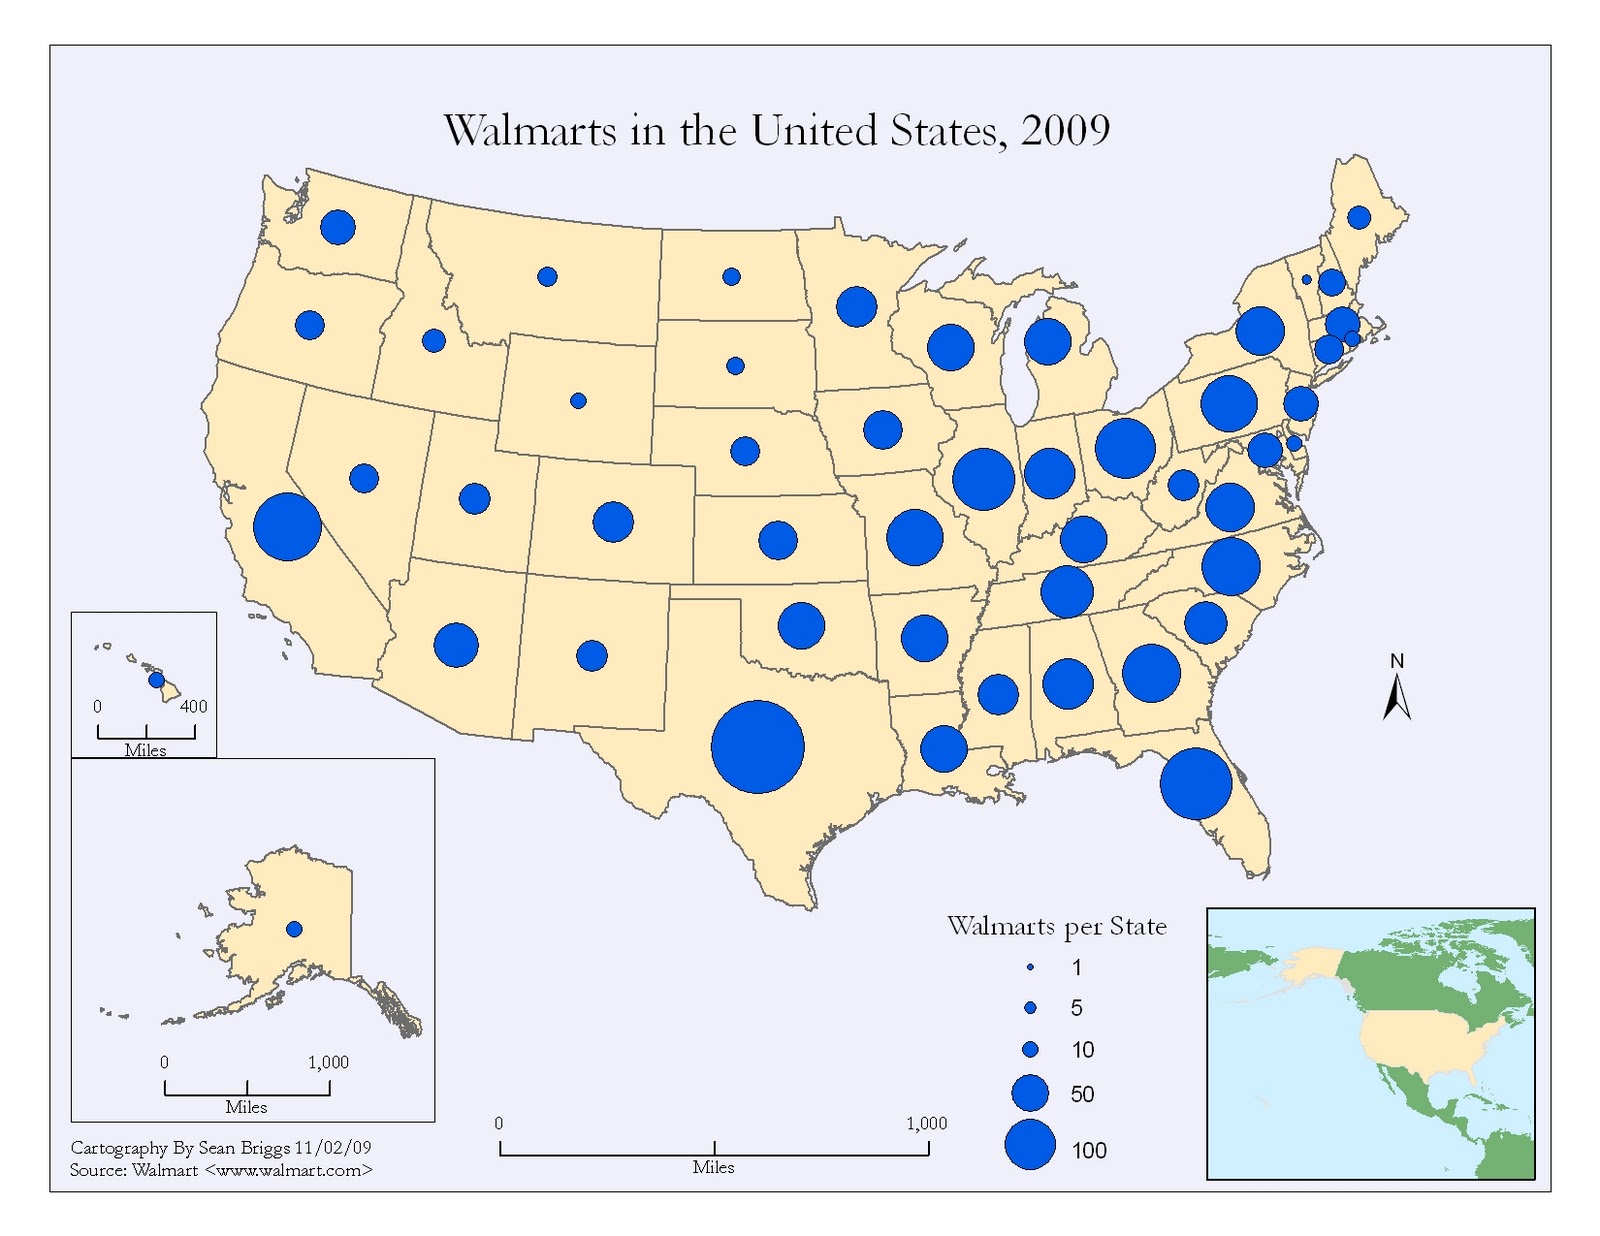
Proportional Symbol Map- symbols vary in size place to place on the map in proportion to the quantities found at that location.
 |
Number of Walmarts per state.
|
Dot Density Map- uses a dot symbol to indicated the presence of a feature at a location. Often used to display population trends or resource location.


No comments:
Post a Comment